
NEUROIMAGING / MAGNETIC RESONANCE IMAGING
Magnetic Resonance Imaging (MRI)
Updated on 15/10/2024, published on 27/05/2022
- MR imaging is based on the behavior of atoms (most often – H, P, and Na) in the magnetic field
- structures generating low signals are hypointense; structures generating high signals are hyperintense; tissues producing no signal are dark (blood, calcifications)
- advantages over CT
- high contrast and resolution, good visualization of pathologies in the posterior fossa
- possibility of imaging in any plane (coronal, sagittal, oblique) and 3D reconstruction
- possibility of non-contrast imaging of the cerebral arteries (TOF, phase contrast angiography); contrast agents are used to visualize extracranial arteries
- significant improvement in the acute stroke diagnosis (DWI, perfusion)
- does not use ionizing radiation
- disadvantages of MRI compared to CT
- higher costs and longer examination times when using traditional protocols (typically lasting 10-30 minutes); novel rapid MR protocols may take less than 10 minutes
- difficulties with ventilated patients, as an MRI-compatible respirator must be available.
- young children and uncooperative patients must be sedated or examined under general anesthesia (the risk of movement artifacts is substantial)
- numerous MRI contraindications
- higher costs and longer examination times when using traditional protocols (typically lasting 10-30 minutes); novel rapid MR protocols may take less than 10 minutes
Magnetic Resonance Imaging modalities
T1

T1C+ (contrast-enhanced)

T1 fat suppressed

T1C+ fat suppressed
T2

FLAIR

GRE

SWI
")
DWI

ADC

Diffusion tensor imaging (DTI) tractography

CSF flow studies

Bright blood
Non-contrast MRA (TOF)

MR venography (TOF)
")
Contrast-enhanced MRA

Dark blood
Fast Spin Echo (FSE) Black Blood MRA

Inversion Recovery (IR) Black Blood MRA
Susceptibility-weighted (SW) Black Blood MRI

T1C+ black blood
 (Obuses, 2014)")
PWI
")
ASL
")
MRS
")
Basic MRI sequences (T1, T2, PD)
- the principle of the method is the detection of T1 and T2 relaxation times (resulting in so-called T1 and T2-weighted images)
- T1 is used for accurate anatomical imaging
- water signal is low; fat is hyperintense
- T1 signal is stronger when the relaxation time is shortened (e.g., due to the contrast agent) → T1C+
- high-resolution MR T1 C+ dark blood sequence (see below) can be used to detect vasculitis

- high-resolution MR T1 C+ dark blood sequence (see below) can be used to detect vasculitis
- fat suppression techniques can be used to improve the contrast between different tissues by suppressing the signal from fat → see here
- CHESS (Fat-Sat)
- STIR
- T2 – better detection of lesions containing more water
- FLAIR sequence is used for water suppression (the CSF is dark, and periventricular lesions can be better distinguished)
- CHESS (Fat-Sat) is used to suppress fat
- PD (proton density) – image quality depends on the density of hydrogen protons in the tissues; not useful in stroke management
")
|
tissue
|
MR-T1
|
MR-T2
|
CT
|
|
bone, calcifications
|
dark
|
dark
|
bright
|
|
water, CSF
|
dark
|
bright
|
dark
|
|
fat
|
bright
|
dark
|
dark
|
|
infarction
|
dark
|
bright
|
dark
|
|
tumor
|
dark
|
bright
|
dark
|
| gadolinium | bright | bright | – |
| air | dark | dark | dark |
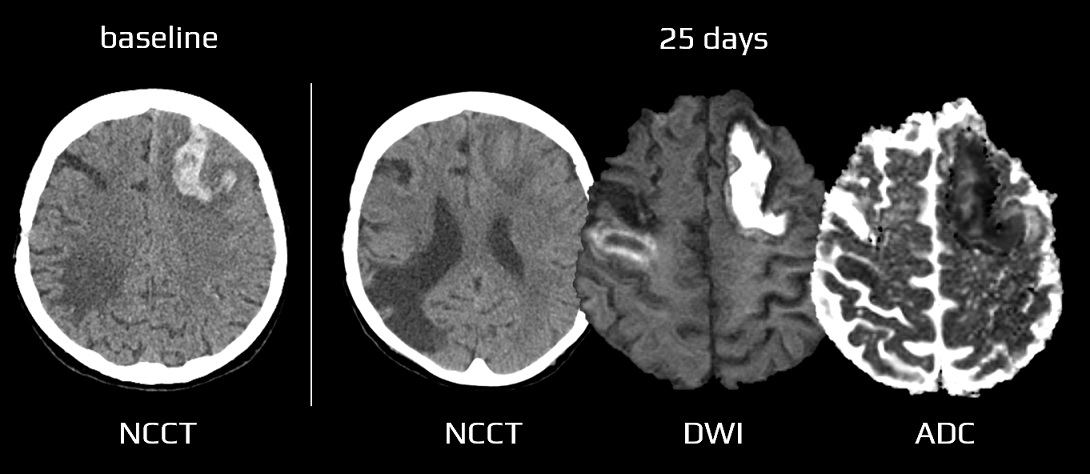
Diffusion-weighted images (DWI)
- DWI visualizes impaired (restricted) diffusion of water molecules (or protons) caused by the energetic failure of Na+/K+ membrane pumps
- it is highly sensitive and specific (88-100%) for detecting acute cerebral infarction within minutes of its onset, with a maximum of 4-6 hours
- acute ischemia appears hyperintense (bright) on DWI (b factor around 1000 s/mm2) and hypointense (dark) on calculated ADC (apparent diffusion coefficient) maps
- ADC <620×10-3 mm/s is likely to identify ischemia
- following recanalization, an increase in signal intensity is often observed on ADC maps within the ischemic area
![After recanalization, there is often an increase in ADC at the site of ischemia (visible on both DWI and FLAIR) [Albers]](data:image/svg+xml,%3Csvg%20xmlns='http://www.w3.org/2000/svg'%20viewBox='0%200%2045%2025'%3E%3C/svg%3E "After recanalization, there is often an increase in ADC at the site of ischemia (visible on both DWI and FLAIR) [Albers]")
- DWI changes are not specific to ischemia – they can occur in any impairment of transport mechanisms (edema). Such changes are often reversible, and lesions are not hypointense on the ADC map)
- artifacts can occur on DWI due to its dependence on the T2 signal
- increased T2 signal can lead to T2 shine through and T2 washout
- reduced T2 signal leads to the T2 blackout phenomenon (hypointense on DWI)


Gradient-echo sequence (GRE)
- paramagnetic substances appear dark (calcification, blood, metals)
- GRE reliably detects both recent and old bleeding, including cerebral microbleeds

- can detect acute ICH (initially, only a dark rim may be visible), SAH, or subtle hemorrhagic complications in ischemic stroke ⇒ GRE should be included in emergency brain MR studies (Kidwell, 2004)
- characteristics of hyperacute hematoma:
- T1 isointense
- T2/FLAIR – isointense or mildly hyperintense
- GRE hypointense (initially only hypointense rim + core of heterogenous signal intensity due to the diamagnetic oxyhemoglobin)
- DWI hyperintense, ADC hypointense
- GRE outperforms CT in the detection of old hemorrhages
- GRE allows the detection of intra-arterial and intravenous thrombi (blooming artifact)


- in addition to dural sinus thrombosis, it can help to detect smaller veins thrombosis
- both the dense artery sign and the blooming artifact are common in erythrocyte-rich thrombi [Liebeskind, 2011]]
It is a “susceptibility artifact” caused by paramagnetic substances
- hemosiderin
- cavernous malformation

- old hemorrhages, microbleeds

- SAH (even small superficial)
- diffuse axonal injury (DAI)
- superficial siderosis
- older thrombus
- detection of cerebral venous thrombosis (CVT)

- excessive blooming from hemosiderin is an unfavorable predictor of recanalization [Chen, 2015]
- detection of cerebral venous thrombosis (CVT)
- cavernous malformation
- calcification
- e.g., neurocysticercosis
- Fahr disease
- metals
- PKAN (Pantothenate Kinase-Associated Neurodegeneration)

- PKAN (Pantothenate Kinase-Associated Neurodegeneration)
- gas
- air embolism
- air embolism
- due to the artifact, SWI is highly sensitive in detecting even small lesions, particularly those associated with hemorrhage or mineralization
Susceptibility-weighted images (SWI)
- SWI is particularly sensitive to paramagnetic substances, such as oxyhemoglobin, deoxyhemoglobin, and methemoglobin, as well as iron deposits
- advantages and disadvantages:
- high-quality images with excellent spatial resolution outperforming GRE (may detect small abnormalities that may not be visible on other MRI sequences)
- long acquisition time
- limited contrast
- SWI is used to detect a variety of abnormalities in the brain (similar to GRE):
- acute thrombus detection
- thrombus is hypointense on MR SWI (deoxyhemoglobin)
- SWI offers high sensitivity to detect thrombi in distal segments (where it often outperforms MRA)
- detection of venous thrombosis
- hypointense signal in affected veins and vessels
- stasis and enlargement in the surrounding veins

- prediction of hemorrhagic transformation
- detection of cerebral microbleeds – up to 6x more sensitive than conventional gradient sequences (their presence increases the risk of bleeding during thrombolysis or anticoagulant therapy)
- early detection of hemorrhagic transformation (higher sensitivity compared to CT and MR GRE)

- detection of cerebral microbleeds – up to 6x more sensitive than conventional gradient sequences (their presence increases the risk of bleeding during thrombolysis or anticoagulant therapy)
- acute thrombus detection
Perfusion weighted imaging (PWI)
- MRI techniques that can show brain perfusion in the following conditions
- stroke (e.g., to determine ischemic penumbra or identify vascular reserve)
- neoplasms (e.g., identify the highest grade component of diffuse astrocytomas, help distinguish glioblastomas from metastases)
- neurodegenerative diseases
- three techniques are used to derive one or more perfusion values
MTT (Mean Transit Time)
- the average time (seconds) it takes for blood to travel through a given volume of brain tissue (from arterial input to venous output)
- it is calculated by dividing cerebral blood volume (CBV) by cerebral blood flow (CBF)
- normal values of MTT
- gray matter: 4 s
- white matter: 4.8 s
- prolonged MTT indicates delayed perfusion (decreased CPP), typically seen in ischemic stroke
TTP (Time To Peak)
- the time at which the contrast concentration reaches its maximum and it does not provide information about overall blood flow or volume
- it focuses on the timing of contrast arrival rather than the transit of blood through tissue
- CONS:
- TTP is very sensitive to motion artifacts and noise
- TTP can be prolonged in a wide variety of acute and chronic hemodynamic conditions
Tmax
- refers to the time taken for the maximum concentration of contrast agent to reach a voxel
- accounts for contrast dispersion, and provides a more accurate measure of perfusion delay
- Tmax is more frequently utilized in stroke imaging due to its greater reliability in assessing ischemic regions
CBF (Cerebral Blood Flow)
- one of the parameters generated by perfusion techniques (CT/MR perfusion)
- CBF is defined as the volume of blood passing through a given amount of brain tissue per unit of time, most commonly ml/min/100 g of brain tissue
- in most instances, relative CBF (rCBF) is calculated instead (relative to contralateral white matter)
CBV (Cerebral Blood Volume)
- CBV or rather relative CBV (rCBV) is one of the parameters generated by perfusion techniques
- CBV is defined as the volume of blood in a given amount of brain tissue (ml/100 g of brain tissue)
- CBV can be calculated by assessing the area under the concentration-time curve
Dynamic susceptibility contrast (DSC) MR perfusion
- widely used in acute stroke for assessing ischemic penumbra and infarct core
- measures the passage of gadolinium-based contrast agent (GBCA) through the brain tissue on T2-weighted sequence
- the same parameters as for CT perfusion (CBV, CBF, MTT, TTP) can be obtained
- tissue with impaired perfusion (↑ MTT) comprises infarction (core, approx. corresponding to DWI lesion), the penumbra and the area of benign oligemia. The difference between the area of impaired perfusion and diffusion approximately determines the size of the penumbra (PWI/DWI mismatch)

Dynamic contrast-enhanced (DCE) perfusion
- uses gadolinium contrast, but images are T1-weighted, focusing on the extravasation of contrast into the extracellular space
- measures permeability of the blood-brain barrier (BBB), useful in evaluating tumor angiogenesis or BBB disruption
- used primarily for brain tumor imaging, but can be useful in assessing BBB integrity post-stroke
Arterial spin labeling (ASL)
- a non-contrast method that magnetically labels arterial blood water as it flows into the brain
- this is done by using a magnetic field gradient to temporarily alter the direction of the protons’ spin, which makes them visible to the MRI scanner. After a short period, the labeled protons pass through the brain and are detected by the MRI scanner
- advantages:
- non-invasive perfusion imaging
- high sensitivity (because it measures the passage of labeled protons through the brain rather than relying on the accumulation of a tracer)
- reproducibility – ASL results are highly reproducible, making it a valuable tool for research and clinical practice
- disadvantages:
- ASL seems to overestimate perfusion lesion compared to other methods
- lower spatial resolution compared to PET/SPECT (may not be able to detect small changes in CBF)
- susceptibility to motion artifacts
- technical challenges (ASL requires a high-field MRI scanner and specialized software)
- less commonly used in acute stroke due to lower sensitivity in detecting small perfusion abnormalities
- useful in these indications:
- chronic cerebrovascular diseases
- degenerative diseases (AD, FTD)
- brain tumors
- migraine (hyperperfusion)
- posterior reversible encephalopathy (PRES)

Contrast-enhanced MRI
- beyond perfusion and angiography, contrast agents are also used to enhance the visibility of certain structures in MRI images
- may improve the visibility of lesions that are not visible on non-enhanced images
- may help distinguish between different types of tissues
- contrast agents facilitate proton relaxation, which shortens the T1 and T2 relaxation times
- a shortening of the T1 relaxation time leads to an increase in signal intensity, while a shortening of the T2 relaxation time leads to a decrease in signal intensity
- contrast agents can be divided into paramagnetic and super-paramagnetic agents
- paramagnetic substances amplify the magnetic field, resulting in a shortening of the relaxation time. They have a wide range of applications and are often used in CNS examinations because of their ability to penetrate damaged BBB – Magnevist (gadopentetate), Omniscan (gadodiamide), Dotarem (Gd-DOTA, gadoteric acid)
- super-paramagnetic agents are solid substances that are introduced into the body as suspensions and are very effective in shortening the relaxation times of protons
- contrast agents are associated with a risk of adverse events and increased costs
MRI angiography (MRA)
MRA techniques
Dark Blood MRA → see here
(vascular imaging strategy where the signal from flowing blood is suppressed – rendering it “black”)
- Fast Spin Echo (FSE) Black Blood MRA
- Inversion Recovery (IR) Black Blood MRA
- Susceptibility-weighted (SW) Black Blood MRI
Bright Blood MRA
- Contrast-enhanced MRA
- Non-contrast MRA
- Time-of-Flight (TOF)
- Phase-contrast (PC)
- Steady-state Free Precession (SSFP)
- Fast Spin Echo (FSE)
- Arterial Spin Labeling (ASL)
MRA applications
Intracranial arteries
- TOF (Time Of Flight) method, without contrast agent administration

- evaluates only flow, false-positive findings are common
- sufficient to show occlusions/stenoses of major arteries


- low sensitivity for peripheral occlusions
- SWI dark blood sequence detects thrombi thanks to blooming artifact
- Phase contrast angiography (PCA)
- T1C+ dark blood sequence helps to detect inflammatory changes in the vessel wall


Extracranial arteries
-
contrast-enhanced MRA (CE-MRA) for extracerebral vessels

-
the stenosis should be measured according to NASCET criteria
- MRA may overestimate stenosis compared to DSA (pseudo-occlusion)
MR venography
- dural sinuses and veins thrombosis
- use non-contrast TOF or SWI

![]()

![]()

![]()
MRI and acute stroke
Novel stroke protocols take less than 10 minutes and involve:
- DWI – essential in the early detection of cerebral ischemia

- FLAIR – usually negative in the acute stage of stroke (cytotoxic edema appear within 3-4 hours); may detect subtle SAH
- GRE
- detection of bleeding, including recent hemorrhagic infarction
- detection of venous or arterial thrombi, characterized by a “blooming artifact“
- MRA
- intracranial – TOF or better PCA technique to detect site and extent of occlusion
- extracranial – contrast-enhanced MRA
- MR perfusion – helps in identifying the penumbra, the potentially salvageable tissue
MRI and dissection
- the image changes over time (through acute, subacute, and chronic phases) – it is necessary to evaluate fat- and blood-suppressed T1, T2, and TOF simultaneously [Habs, 2011]
- in the subacute phase, the T1 sequence shows a thrombus in the false lumen (T1 hyperintense ring)
- MRA shows a luminal narrowing and possibly a thrombus in the false lumen

![Different stages of an ICA dissection on MRI [Habs, 2011]](https://www.stroke-manual.com/wp-content/uploads/2022/05/dissection-on-MRI-stages.jpg "Different stages of an ICA dissection on MRI [Habs, 2011]")
")

![]()
MRI and intracranial hemorrhage
- the paramagnetic properties of hemoglobin derivatives are responsible for the MRI signal changes
- imaging depends on the degree and extent of hemoglobin conversion within the coagulum (see the table)
- in the acute stage of hemorrhage, the finding in T1,2 is non-specific
- subsequently, as oxyhemoglobin converts to deoxyhemoglobin (peaking around day 2), a characteristic decrease in T2 signal intensity is observed
- in the following days, methemoglobin levels rise, causing the lesion to become hyperintense (mainly in T1 and PD)
- ~ 2-4 weeks later, a rim of low signal intensity appears in T2, corresponding to hemosiderin in macrophages
- gradient echo sequence (GRE) can also detect early bleeding with similar sensitivity to CT, allowing MRI to be used as an initial imaging method in the acute stroke setting [Lin, 2001]
- GRE is more sensitive than CT for detecting old bleeding and is equally effective for detecting hemorrhagic infarction [Renou, 2010]
- DWI/ADC
- does not effectively differentiate between hemorrhagic infarction and ICH
- hemorrhage is hyperintense in the hyperacute and late subacute stages, hypointense in the acute, early subacute, and chronic stages [Kang, 2001]
- mean ADC ratio is 0.70-0.73 in early stages and 2.56 in chronic stages [Kang, 2001]
- in ischemia, the ADC lesion typically becomes hyperintense around day 30; with hemorrhage, hypointensity persists for over 100 days [Ebisu, 1997]
| Content available only for logged-in subscribers (registration will be available soon) |
| Content available only for logged-in subscribers (registration will be available soon) |
|
Hemorrhage stage
|
T1
|
T2/FLAIR
|
GRE | DWI (Kang 2006) |
|
|
Hyperacute
 |
< 24 h
oxyhemoglobin (IC)
with collateral edema |
iso
|
hyper
|
variable
(hypointense rim) |
hyper |
|
Acute
 |
1-3 days
deoxyhemoglobin (IC)
with collateral edema |
iso-hypo
|
hypo
hyperintense rim
|
hypo
|
hypo |
|
Subacute (early and late)
   |
3-7 days
methemoglobin (IC) 7-28 days
methemoglobin (EC)
|
hyper
|
hypo
early subacute hyper
late subacute
|
hypo
hyperintense with hypointense rim |
hypo
|
|
Chronic
  |
> 28 days
hemosiderin
|
iso → hypointense
|
hypo
|
hypointense rim
|
hypointense |
|
Late chronic
|
months nonparamagnetic hemochromes |
hypo
|
hyper
|
hypointense rim
|
hypointense |
- GRE/SWI sequence: hypointense in all stages (except for the late subacute phase)
- in the hyperacute phase, there may only be a dark rim if not enough deoxyhemoglobin is present


