NEUROIMAGING / COMPUTED TOMOGRAPHY
CT perfusion (CTP)
Updated on 02/06/2024, published on 21/12/2022
- brain infarction is the consequence of a localized decrease in cerebral blood flow (CBF)
- CT perfusion (CTP) can be used to assess cerebral blood flow and differentiate the penumbra (salvageable brain tissue) from the core (area of damaged brain tissue)
- CTP does not detect necrotic tissue; it demonstrates the decrease in blood flow often associated with necrosis
- however, necrosis may not necessarily be present in the core area – if the altered CBF corresponding to the core is detected shortly after stroke onset and rapid recanalization occurs, a portion of this zone may be salvageable
- conversely, in necrotic tissue, flow improvement may be achieved after late recanalization, and the core and penumbra may disappear or be reduced
- similarly, late recruitment of collaterals can improve flow in the periphery of the “core,” potentially reducing its size on CTP, even though it is a zone of complete ischemia
- however, necrosis may not necessarily be present in the core area – if the altered CBF corresponding to the core is detected shortly after stroke onset and rapid recanalization occurs, a portion of this zone may be salvageable
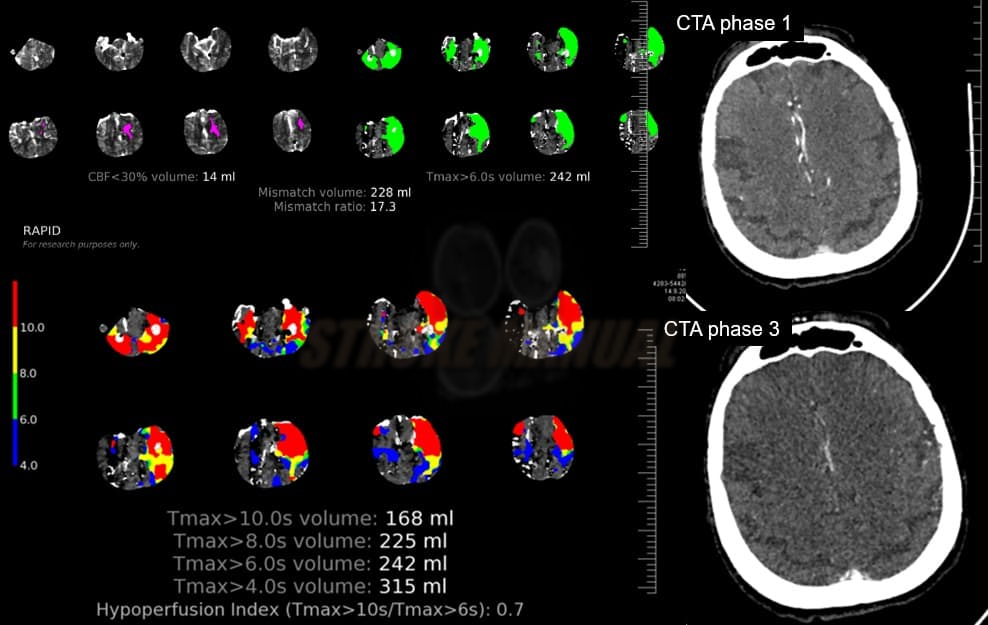
- the CTP mismatch evaluated by the RAPID system became the basis of breakthrough studies with recanalization therapy beyond the standard time windows (> 4.5 h for intravenous thrombolysis, > 6h for mechanical thrombectomy)
- the DAWN study (2017) showed an effect in the 6-24h window in a strictly selected group (based on CTP findings)
- in January 2018, the DEFUSE study) presented positive results in the 6-16 hours window (Odds Ratio 2.77!!)
- EXTEND trial (2019) showed that the use of tissue plasminogen activator (tPA) between 4.5 – 9.0 hours after stroke onset in patients with hypoperfused but salvageable brain regions (detected by CTP) resulted in a higher percentage of patients with no or minor neurological deficit compared to placebo
Technical comments
- after the intravenous administration of an iodinated contrast agent, a transient increase occurs in parenchymal density, which is proportional to the amount of contrast agent in the area
- administration rate: 5-6 mL/s; the green cannula is required (18G, 1.3 mm)
- the software calculates CTP parameters from time-attenuation curves, which are based on the differences between arterial inflow and venous outflow
- software processing of the measured brain tissue density during the passage of a contrast agent yields 4 parameters:
- Cerebral Blood Volume (CBV) – amount of blood in a given volume of tissue (mL per 100 mg of tissue)
- Cerebral Blood Flow (CBF) – blood flow (mL/100g of tissue/minute)
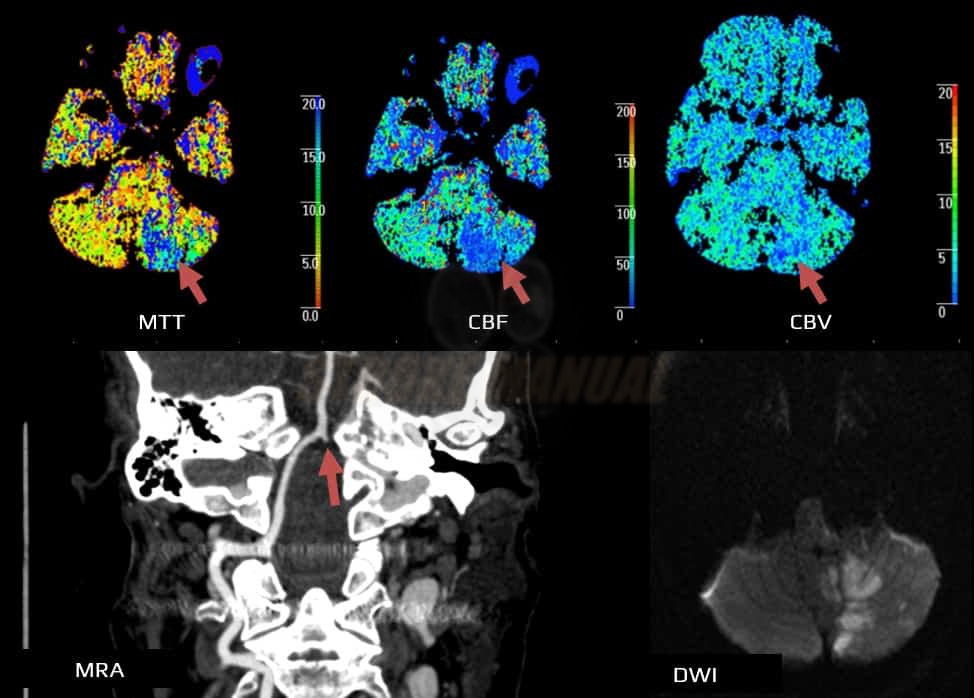
- Mean Transit Time (MTT) – average time of arteriovenous blood passage by a given volume of tissue (in seconds)
- Time To Peak (TTP) – average time to maximum density in the scanned area (in seconds)
- the relationship between the above parameters is expressed by the equation: CBF = CBV / MTT; based on the measured and calculated values, colored perfusion maps are generated for each parameter, thereby facilitating the distinction and comparison of areas with varying blood flow
Evaluation of CTP maps
Mean Transit Time (MTT)
- start with assessing the MTT (TTP) parameter, which is prolonged in ischemia (>145% of contralateral normal tissue) and serves as a marker of regional blood flow abnormalities
- normal MTT/TTP effectively rules out arterial occlusion
- however, MTT is not suitable for assessing viability; it only identifies areas of slower contrast-filling
- normal MTT/TTP effectively rules out arterial occlusion
- the MTT area includes:
- benign oligemia (persistent occlusion usually doesn’t result in infarction in this area)
- infarct core (irreversibly damaged tissue)
- penumbra (tissue that can be rescued by prompt recanalization therapy)
Cerebral Blood Flow and Volume (CBF and CBV)
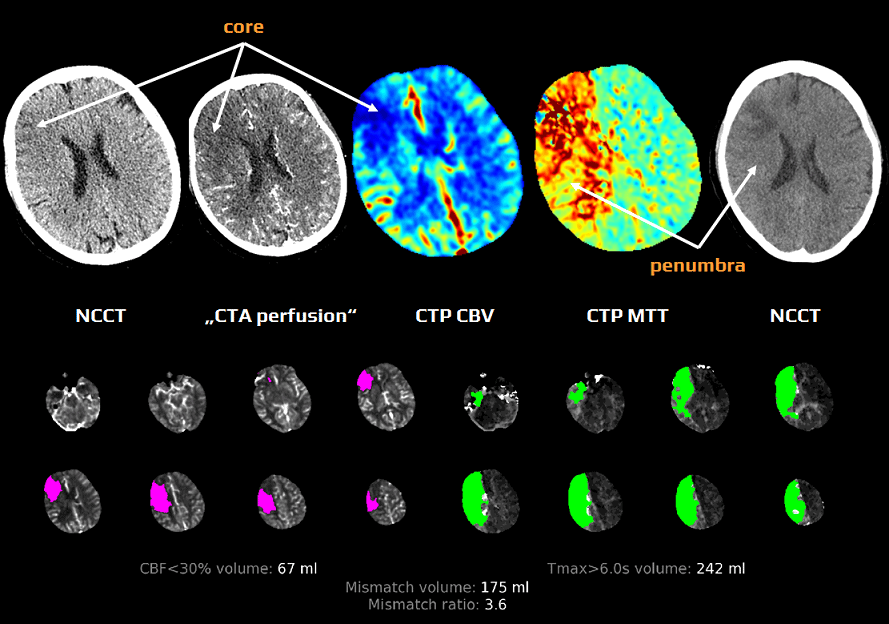
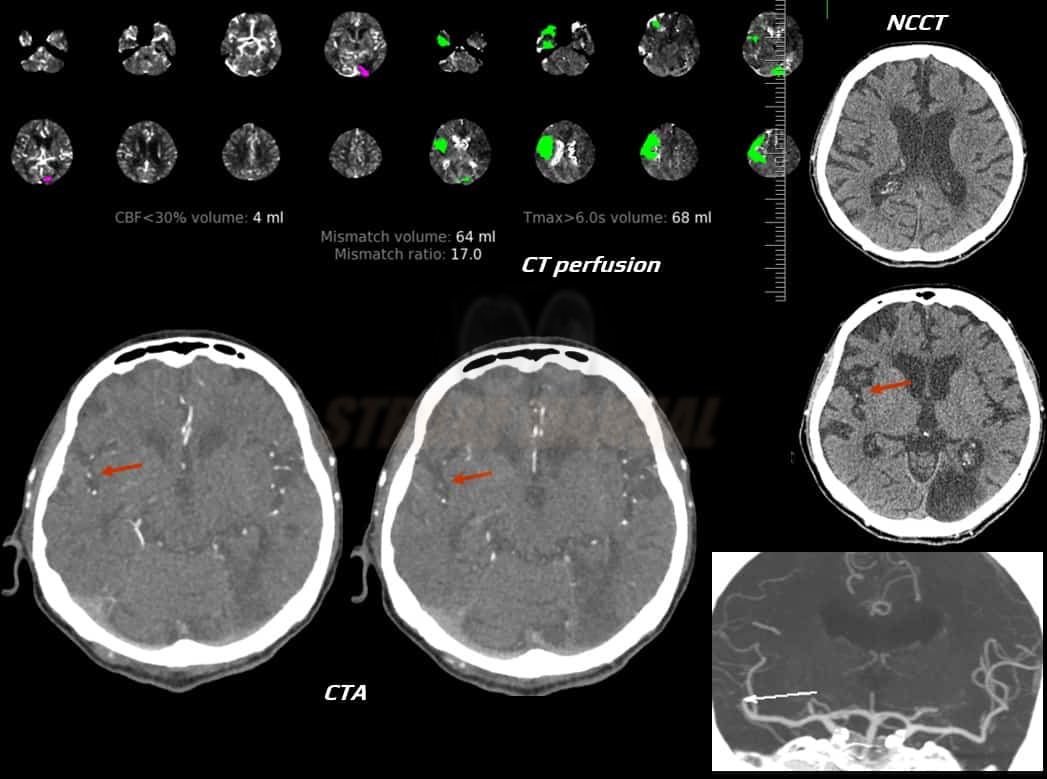
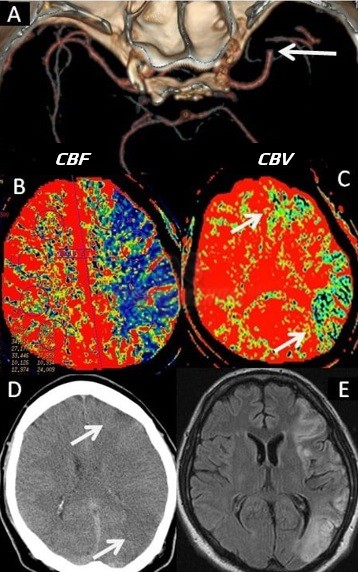
CBF and CBV parameters and Tmax > 6s (RAPID system) can differentiate between the infarction core and the ischemic penumbra. The interpretation of CTP parameters and assessing core versus ischemic penumbra is based on relative values, using the contralateral hemisphere as a reference. Issues may arise in case of concomitant contralateral carotid artery stenosis, leading to contrast delay in the reference hemisphere).
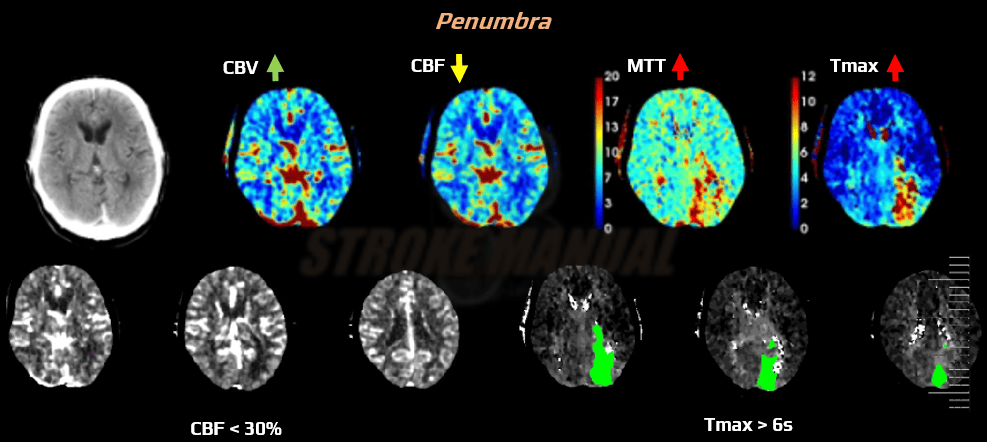
- benign oligemia – an area sufficiently supplied via collaterals will exhibit prolonged MTT but normal or even increased CBV and slightly decreased CBF
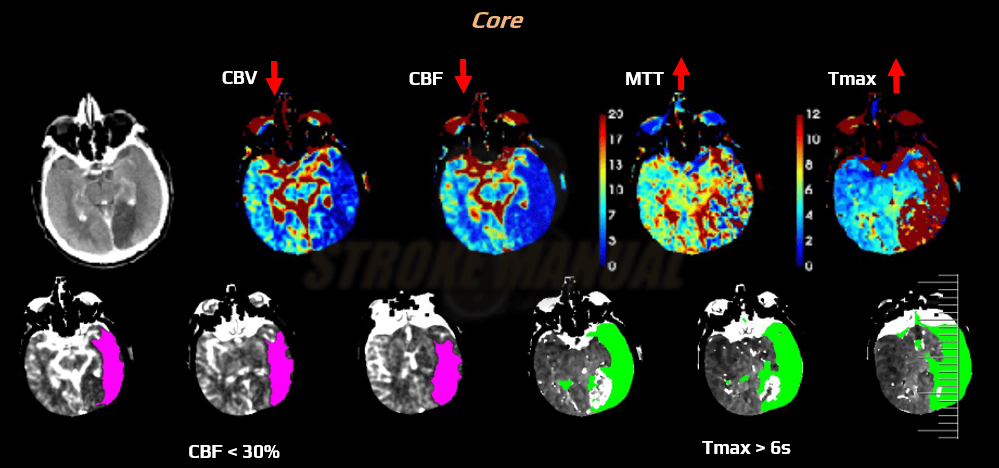
- core
- CBF <30% compared to the contralateral side (RAPID system)
- correlation with MR DWI was observed in the SWIFT PRIME trial [Albers, 2016]
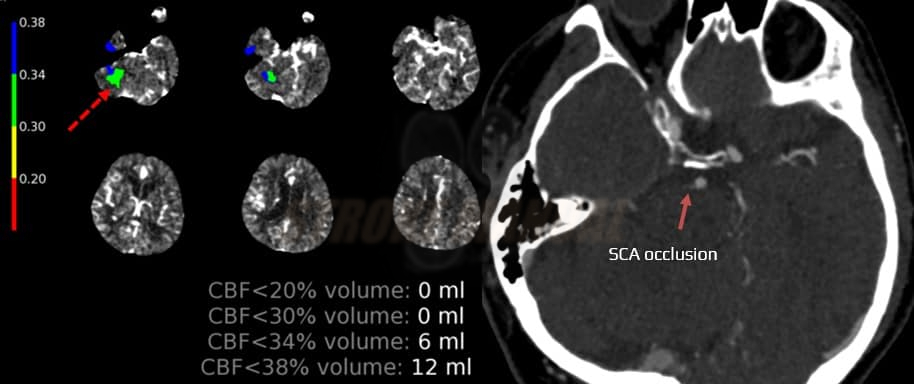
- the core extent may not correlate with the final infarct extent
- CBV < 30% compared to the contralateral side
- CBF <30% compared to the contralateral side (RAPID system)
- ischemic penumbra (perfusion deficit/core mismatch)
- according to the RAPID system, area Tmax > 6s minus core (an area of CBF < 30% of the contralateral side)
- an area with reduced CBF (< 65% of the healthy side) minus core (CBV <30% of the contralateral side)
- CBV is normal or increased
Clinical-core mismatch
- a mismatch between age-adjusted NIHSS and CTP core (defined as stated above) (Chen, 2021)
- NIHSS ≥10 + core volume <31 mL (age <80)
- NIHSS ≥20 + core volume 31–51 mL (age <80)
- NIHSS ≥10 + core volume <21 mL (age ≥80)
Hypoperfusion intensity ratio (HIR)
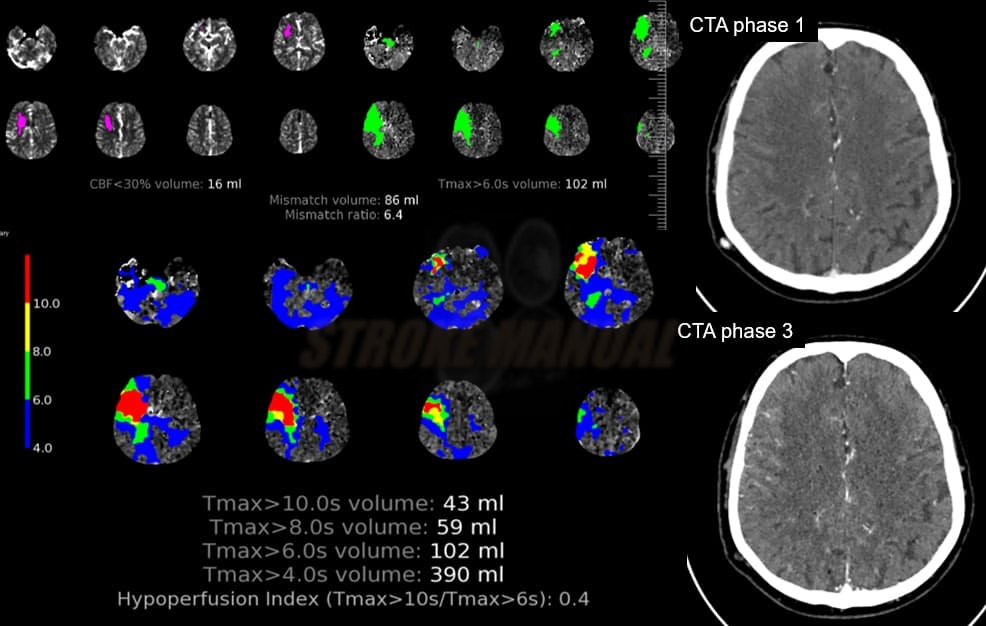
- Hypoperfusion Intensity Ratio (HIR) or hypoperfusion index : defined as Tmax > 10s / Tmax > 6s
- an index ≥ 50% correlates with poor collaterals on angiography; such patients had an 83% probability of significant core growth [Guenego, 2018]
- poorer (higher) HIR is associated with the occurrence of parenchymal hematoma (PH) after EVT (HIR might reflect tissue vulnerability to reperfusion hemorrhage) (Winkelmeier, 2022)
- high HIR on baseline imaging may warrant repeat brain imaging upon transfer to a comprehensive stroke center to avoid futile endovascular procedure

