ADD-ONS / SCALES
Clot Burden Score (CBS)
David Goldemund M.D.
Updated on 21/04/2024, published on 20/12/2022
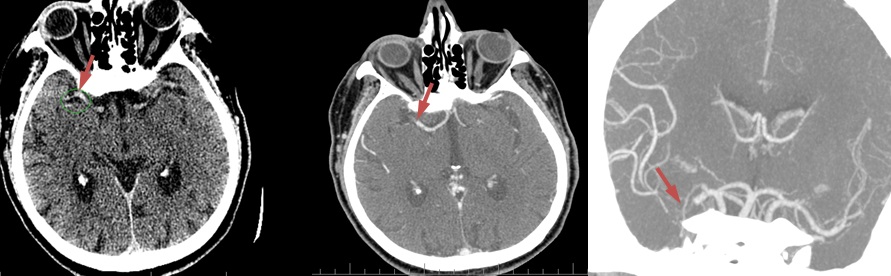
- the extent of intracranial thrombosis predicts clinical outcome, final infarct size, and risk of hemorrhagic transformation in acute ischemic stroke
- clots with proximal localization and increased length are more difficult to treat and have a worse outcome
- Clot Burden Score (CBS) is a semiquantitative, CTA-based score that defines the extent of thrombosis in the anterior circulation
- 10 points are assigned for a normal CTA
- 2 points are subtracted for thrombus in the proximal M1, distal M1, or supraclinoid ICA portion
- 1 point is subtracted for thrombus in M2 branches, A1, and/or infraclinoid ICA portion
- 2 points are subtracted for thrombus in the proximal M1, distal M1, or supraclinoid ICA portion
- the recanalization rate is higher with intravenous tPA in patients with a CBS > 6 [Demchuk, 2009]
- a lower CBS is associated with:
- lower ASPECTS [Puetz, 2008]
- higher rates of parenchymal hematoma [Puetz, 2008]
- decreased odds of favorable functional outcome
- odds ratio 0.09 for CBS ≤ 5, 0.22 for CBS 6-7, and 0.48 for CBS 8-9 [Puetz, 2008]
- the association between the CBS and functional outcome varies for different collateral scores (Derraz, 2021)
- CBS can also be assessed on FLAIR, MRA, or MR-GRE (T2*CBS)
 [Derraz, 2019]
- susceptibility vessel sign (SVS)
- diameter and length (thrombus length tends to be smaller in those with early reperfusion)
- S-shaped or A-shaped
- clot intensity on FLAIR
- high FLAIR clot intensity may predict successful reperfusion (Fujimoto, 2015)
- susceptibility vessel sign (SVS)
| infraclinoid portion of ICA | – 1 |
| supraclinoid portion of ICA |
– 2 |
| proximal M1 segment |
– 2 |
| distal M1 segment |
– 2 |
| M2 branch |
– 1 |
| M2 branch |
– 1 |
| ACA | – 1 |
")
")
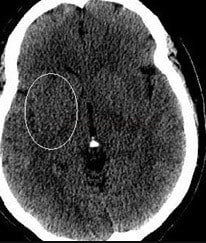
 - Clot Burden Score 5")
")
")


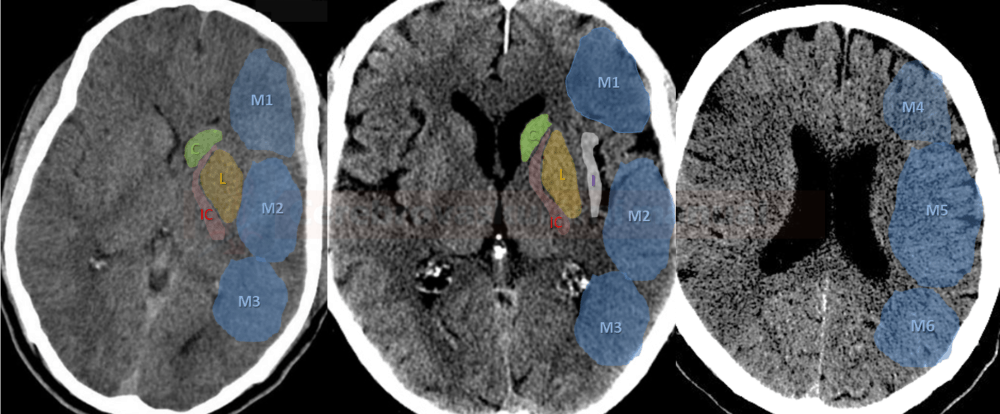
 assessed on CT angiography source images")


![pc-ASPECT score predicts prognosis [Puetz, 2009]](https://www.stroke-manual.com/wp-content/uploads/2021/03/pc-aspects_prognosis-Puetz.jpg "pc-aspects_prognosis - Puetz")
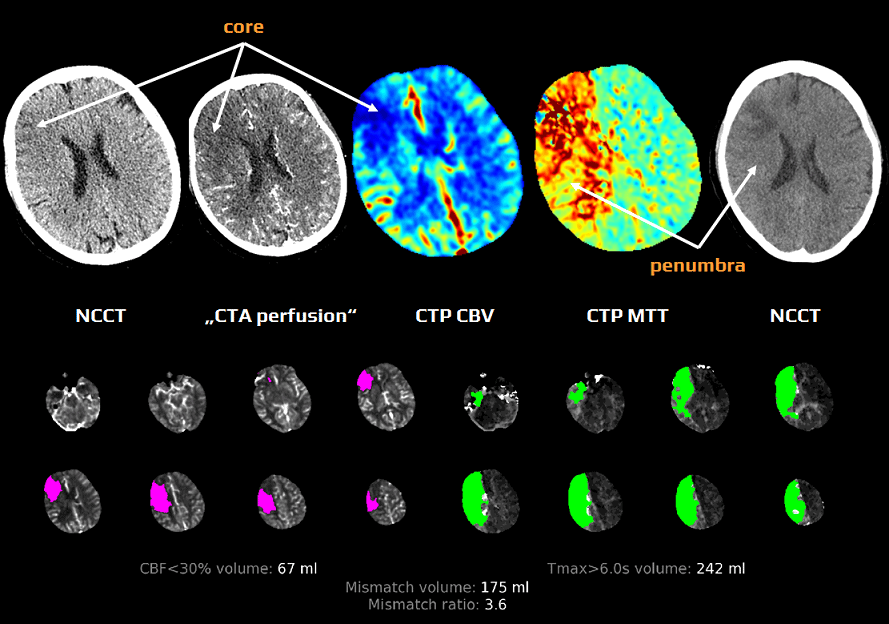


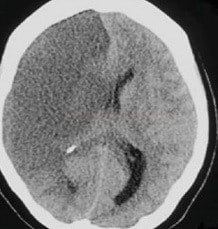
 and areas with low CBV (C) showing core. IV thrombolysis led to rapid recanalisation, so NCCT and MRI control show infarction in regions of presumed core.")

")
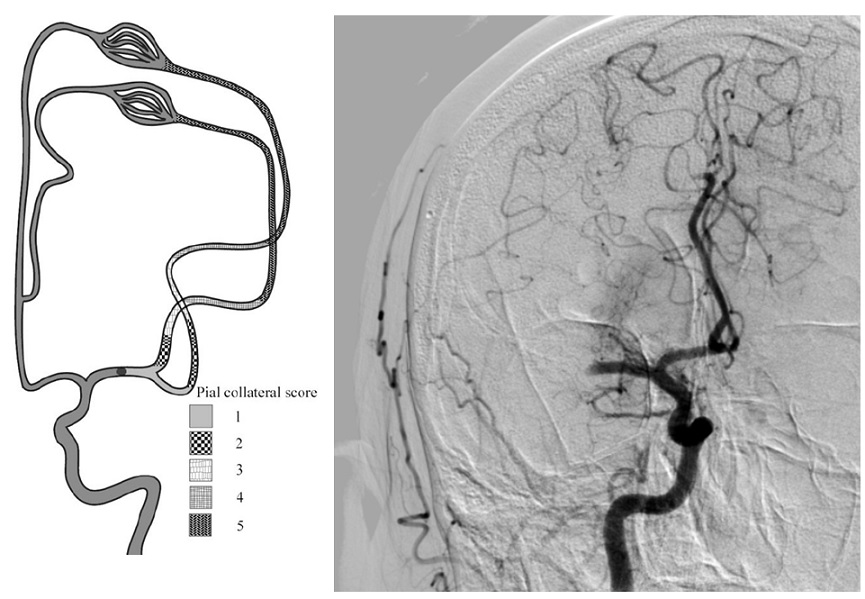
, with poor collaterals on multi-phase CTA (mCTA)")

")

")


 stenosis on CTA")


")
")
 corresponding to specific millimeter stenosis measures, calculated from the respective gender-specific linear regression models. The shaded areas represent the millimeter stenosis ranges that correspond to the estimated percentage stenosis ranges that include the 70% and 50% stenosis cut-off values (severe and moderate stenosis, respectivel")

 and hypoperfusion on CT angiography source images (\"CTA perfusion\") (C,D)")


")